How to read the Schumann Resonance Chart
Learn how to simply read the Schumann Resonance Chart from a Spiritual point-of-view.
My personal approach
Over time, I've noticed periods where I seem more sensitive. Sometimes I experience digestive changes, headaches, dizziness, feeling spacey, vivid dreams, or an unusually active intuitive inner dialogue (I call this - channeled chatter). My husband often notices increased discomfort with fibromyalgia flares during periods of intense Schumann Resonance activity.
Whatever may be the cause of these changes, I choose not to give the chart authority over my experience. I don't wake up expecting to feel unwell because of a white spike.
Instead, I use it as a gentle reminder or a check-in to slow down and support myself.
If I notice heightened activity, I may spend more time grounding, walking barefoot on natural surfaces, meditating, drinking water, eating nourishing food, resting, regulating my nervous system, or simply paying closer attention to what my body is asking for.
Discernment over dependency
If you resonated with this (pun intended🫢) and would like to connect, my DMs are always open.
~ Rio Kashyap
Schumann Resonance, Chakras, and Human Energy:
How to read the chart from a Spiritual POV.
If you've spent any time in spiritual circles, you've probably seen someone post a Schumann Resonance chart covered in bright white streaks and declare that "the Earth's frequency is skyrocketing" or that "humanity is upgrading."
I understand why those interpretations are appealing. I also believe it's important to approach them with discernment.
For me, the Schumann Resonance chart isn't something I use to predict my day or explain every symptom I experience. It's simply one data point that reminds me to pay closer attention to my body, my nervous system, and my spiritual practices.
So, what is the Schumann Resonance?
The Schumann Resonance is a naturally occurring electromagnetic phenomenon created by lightning strikes interacting with the cavity between the Earth's surface and the ionosphere.
The Earth "rings" with several resonant frequencies, the strongest being approximately 7.83 Hz, followed by harmonics around 14 Hz, 20 Hz, 27 Hz, and 33 Hz.
On most public charts.
One important distinction: the chart does not necessarily mean that the Earth's base frequency is constantly changing. More often, it shows changes in the strength of naturally occurring resonances.
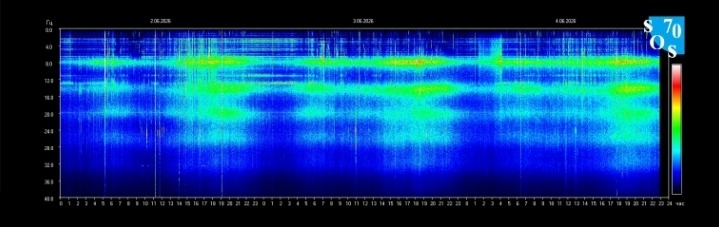
How I Read the Chart
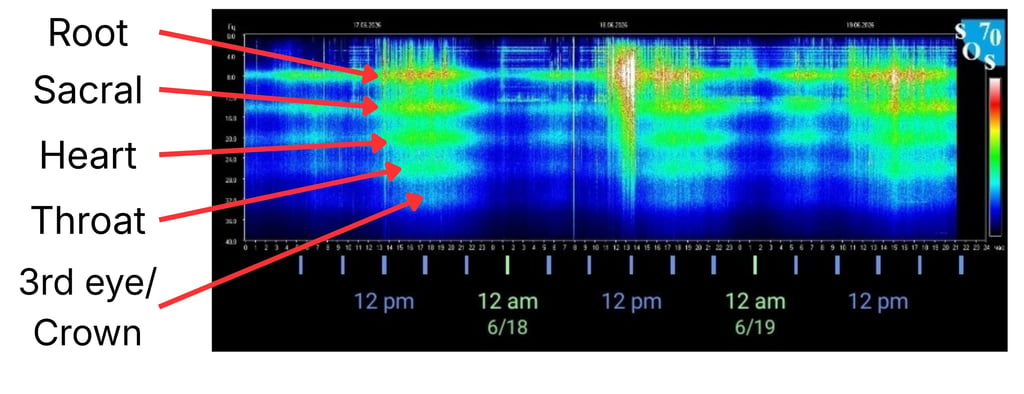
Rather than focusing only on the bright white spikes, I pay attention to where on the chart they appear.
The horizontal bands represent different frequency ranges. While there is no scientifically established mapping between Schumann resonance frequencies and the chakra system, some energy practitioners use these ranges as a symbolic framework for reflection and self-observation. I find it to be an interesting lens through which to explore my own experiences.
For example:
Around 30–40 Hz (Gamma range): Often associated with heightened awareness, expanded consciousness, and moments of insight. Spiritually, some people relate this range to the third eye or crown chakras.
Around 13–30 Hz (Beta range): Linked with active thinking, focus, communication, and self-expression. Symbolically, this range is sometimes connected with the throat chakra and, in its lower frequencies, the solar plexus.
Around 8–12 Hz (Alpha range): Associated with calm alertness, relaxation, creativity, and emotional balance. Some practitioners relate this state to the heart chakra, where harmony and openness are emphasized.
Around 4–8 Hz (Theta range): Connected with deep meditation, intuition, imagination, and inner healing. This range is often symbolically associated with the sacral chakra and deeper subconscious processes.
Around 7.83 Hz, the Earth's fundamental Schumann resonance: Sitting near the boundary between theta and alpha brainwave activity, it is frequently associated in spiritual circles with grounding, stability, and the root chakra, although this relationship remains symbolic rather than scientifically validated.
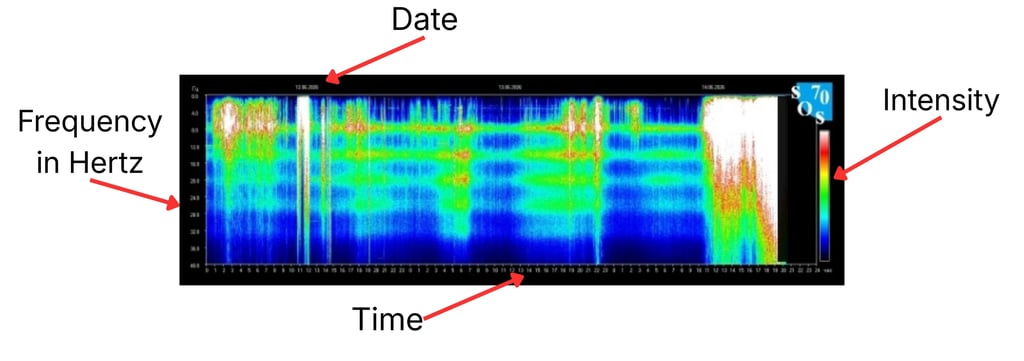
- X-axis: Flows from left to right, typically displaying a 24-hour window in UTC or local time.
- Y-axis: Runs from bottom to top, measuring ELF (Extremely Low Frequency) waves from 0 Hz to 40 Hz.
- Color brightness (Amplitude): Brighter colors (white, bright blue, or red) indicate high-power, strong electromagnetic activity. Darker colors (black, deep purple) indicate low activity.
- Bright white areas generally indicate stronger electromagnetic activity at that frequency.
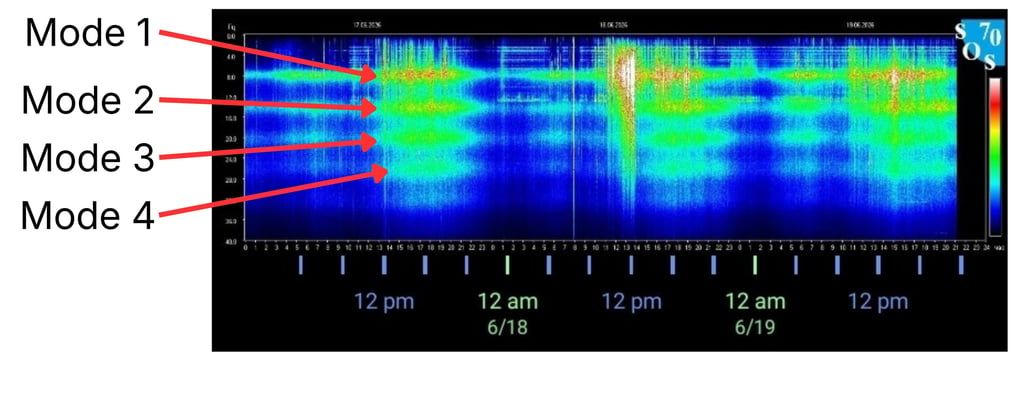
The chart displays continuous horizontal bands corresponding to the primary Earth-ionosphere resonant modes:
Mode 1: ≈ 7.83 Hz (The fundamental "heartbeat" frequency)
Mode 2: ≈ 14.1 Hz
Mode 3: ≈ 20.3 Hz
Mode 4: ≈ 26.4 Hz
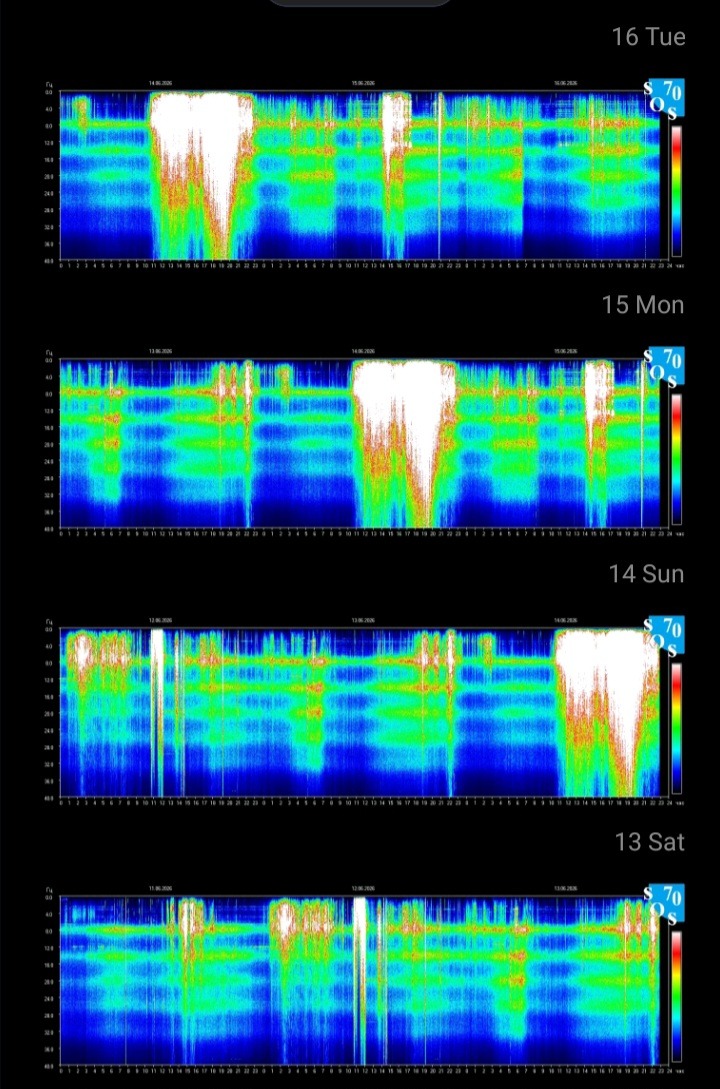
A period of Intense activity:
When I observe intense activity (White bands) at different levels of the chart, I sometimes reflect on which aspects of my inner world or energetic experience might be asking for attention through symptoms. Not as proof of a chakra activation, but as a meaningful tool for personal awareness.
Some practitioners interpret deeper white spikes extending downward through multiple frequency bands as representing energy reaching into progressively higher chakras, with activity approaching the highest frequencies symbolically corresponding to the 3rd eye/crown chakras and themes of heightened perception, psychic activity, vivid dreams, lightheadedness, ear ringing, etc.
I view this as a metaphorical framework for reflection rather than a literal measurement of chakra activity.
What about brainwaves?
This is where things become especially fascinating.
Our brains naturally produce electrical rhythms that can be measured with electroencephalography (EEG):
- Delta (0.5–4 Hz): deep sleep
- Theta (4–8 Hz): dreaming, meditation, creativity
- Alpha (8–12 Hz): relaxed awareness
- Beta (13–30 Hz): active thinking and concentration
- Gamma (30+ Hz): complex processing and integration
The Earth's fundamental Schumann Resonance of approximately 7.83 Hz sits near the boundary between theta and alpha brainwave activity. Some researchers and practitioners have speculated that there may be meaningful interactions between these ranges.
However, no scientific consensus currently demonstrates that Schumann Resonance directly entrains human brainwaves or causes shifts in consciousness.
Humans are electrical beings.
One reason this topic captures my curiosity is because our bodies genuinely operate through bioelectricity.
Every heartbeat is driven by electrical signaling.
Every thought involves electrical activity between neurons.
Our nervous system and fascia depends on electrical impulses.
Our muscles contract because of electrical signals.
Even our blood carries electrically charged ions such as sodium, potassium, calcium, and chloride, which are essential for normal physiology.
There is also growing scientific interest in the electrical properties of connective tissues, including fascia. Some researchers have explored how fascia may conduct or respond to bioelectrical signals within the body, although many aspects of this research are still developing.
In other words, we are not just biochemical beings, we are bioelectrical beings as well.
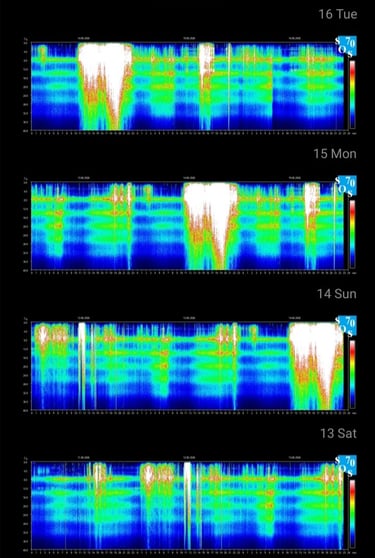
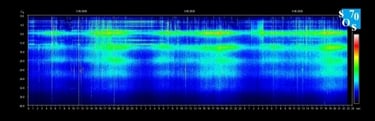
A relatively "calm" chart looks like this:
© Copyright Rio Kashyap 2026